Transparency · Accountability · Prosperity
Minister's Press Briefing · August 2026

Nigeria's Economic Reforms — By the Numbers

Understanding Nigeria’s Public Finances

A simple, transparent account of where public resources came from, how the money was spent, what has changed, and what the reforms mean for Nigerians.

Key figures at a glance
₦15.8tn
Estimated subsidy savings across the FederationShared across the Federal, States, Local Governments and other statutory recipients.
₦20.4tn
Incremental Federal Government resourcesFederal Government subsidy savings, other incremental revenues and incremental borrowing.
₦30.6tn
Incremental expenditure pressuresAdditional spending on wages, debt service, infrastructure, electricity support, social programmes and other obligations.
Follow the money

The numbers tell a financing story — not simply a “savings” story.

The ₦15.8 trillion commonly described as subsidy savings was not retained by the Federal Government alone. It was shared across all the tiers of government. The Federal Government’s estimated share was ₦5.43 trillion. When combined with ₦3.12 trillion in other incremental revenues and ₦11.85 trillion in incremental borrowing, the Federal Government had approximately ₦20.4 trillion in incremental resources.

Over the same period, additional expenditures amounted to approximately ₦30.64 trillion. Subsidy removal therefore did not create one large pool of cash available to the Federal Government. It reduced a major fiscal burden and the amount of additional borrowing that would otherwise have been required.

How to read the story: the supporting analysis shows subsidy removal reduced the amount of borrowing that would otherwise have been required rather than creating one large pool of cash. It also links the broader post-reform revenue gains to concurrent revenue and FX reforms. The sections below therefore separate what was shared across the federation, what the FG actually had, how it was spent, and what changed in the economy.
01

What Happened to the Resources Shared Across Government?

The fiscal impact of the reforms was not confined to the Federal Government.

States and local governments received significantly higher allocations through the Federation Account, increasing the resources available to meet salaries, pensions, infrastructure and other responsibilities at the subnational level that benefit the people.

This distinction is important because many public services Nigerians rely on are delivered by state and local governments.

Against the pre-removal monthly run-rate, states received about ₦9.17tn in additional allocations from June 2023 to December 2025.
Local governments received about ₦6.66tn in additional allocations over the same period.
FAAC resources after subsidy removal
Hover over each bar for the exact figure. The “additional” view compares actual post-removal receipts with what each recipient would have received if the pre-removal monthly run-rate had simply continued.
02

How Were the Estimated Subsidy Savings Shared?

The ₦15.8tn estimate was distributed across different tiers.

Federal Government — ₦5.43 trillion
States — ₦6.52 trillion
Local Governments — ₦3.88 trillion

States collectively received the largest effective share of the estimated subsidy savings.

Share of estimated subsidy savings
Hover over a segment to see both the naira amount and its share of the total.
03

What Resources Did the Federal Government Actually Have?

The Federal Government’s incremental resources came from three principal sources:

Federal Government share of subsidy savings₦5.43tn
+
Other incremental revenuesPrimarily higher remittances from government-owned enterprises and other revenue improvements.₦3.12tn
+
Incremental borrowing₦11.85tn
=
Total₦20.40tn

This is the appropriate Federal Government resource envelope against which the additional expenditure pressures should be considered.

04

How Was the Money Spent?

Additional expenditures over the period amounted to approximately ₦30.64 trillion.

₦9.39 trillion Wage adjustments: minimum wage increases, wage awards, allowances and related personnel costs.
₦9.37 trillion External debt service — exchange-rate impact: the additional naira cost of meeting existing foreign-currency debt obligations following exchange-rate depreciation.
₦6.47 trillion Strategic infrastructure development: investment in major transport, housing, agricultural, security and other strategic infrastructure.
₦3.14 trillion Electricity subsidy: additional government support to cushion the impact of electricity tariffs on consumers.
₦1.24 trillion Domestic debt service — interest-rate impact: additional domestic debt-service costs associated with higher monetary policy rates.
₦423.8 billion Social welfare programmes: funding for targeted social and household-support initiatives.
₦419.1 billion FCT development, ecological, natural-resource and related obligations.
₦201.3 billion Higher naira cost of other foreign obligations.

Government also increased spending on security and made various payments, refunds and reimbursements connected to states and other statutory obligations.

Incremental expenditure — ₦30.64tn
05

If Revenue Improved, Why Did Government Still Borrow?

Because the additional expenditure pressures were larger than the additional resources available.

Approximately two-thirds of the additional spending was funded from incremental resources, while the remaining one-third had to be absorbed within government’s existing revenue base. Subsidy removal therefore resulted in less borrowing than would otherwise have been required, rather than eliminating the need to borrow. Government borrowing remains subject to National Assembly approval and the applicable fiscal and debt-management framework.

The important questions are therefore not simply whether government borrowed, but: How much was borrowed? Was it within approved limits? What was it used to finance? Can government sustainably service the debt?

Incremental spending₦30.64tn
Incremental resources₦20.40tn
Existing revenue base₦10.24tn
₦20.40tn · 67%
₦10.24tn · 33%
06

What Social Programmes Were Funded?

The reforms created additional fiscal space for programmes intended to support households, students and access to finance. The supporting analysis identifies approximately ₦423.8 billion in incremental social-welfare initiatives.

NELFUND — ₦223.8 billion
Supporting access to tertiary education through Nigeria’s student-loan programme.
Mortgage Refinance and Investment Fund — ₦150 billion
Supporting access to affordable housing finance.
CREDICORP — ₦50 billion
Supporting expanded access to consumer credit.

These interventions sit alongside other social transfers and programmes targeting vulnerable households.

Incremental social-welfare programmes
Hover over a programme for the exact amount and share of the ₦423.8bn total.
07

Where Did Strategic Infrastructure Spending Go?

Approximately ₦6.47tn in additional expenditure was directed towards strategic infrastructure development.

Major areas include:

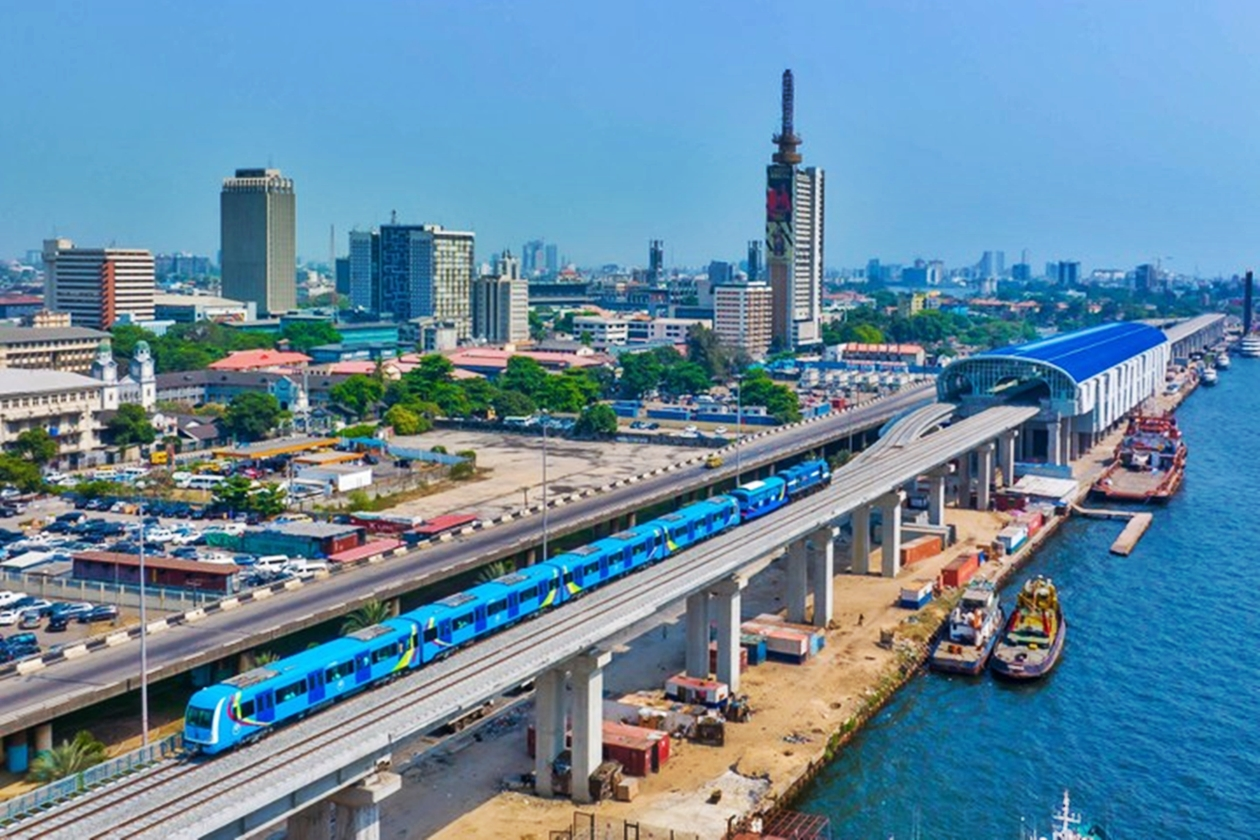
Lagos–Calabar Coastal Highway
Sokoto–Badagry Superhighway
Trans-Sahara Superhighway

The objective is to use improved fiscal capacity to address infrastructure constraints that limit investment, productivity and economic growth.

Selected strategic infrastructure payments
The chart shows selected named projects from the schedule rather than every project. Hover for the payment amount.
11 Key Economic Reforms

The reform agenda is broader than subsidy removal.

01Fuel Subsidy Reform

Reducing a major fiscal burden and changing how resources are distributed across the Federation.

02Foreign Exchange Market Reform

Moving towards a more transparent and market-reflective foreign-exchange system and improving access to FX.

03Revenue Mobilisation

Increasing tax revenues and strengthening remittances from government-owned enterprises.

04Tax Reform

Creating a simpler and more growth-friendly tax system while protecting low-income earners and small businesses.

05Monetary Financing Discipline

Reducing reliance on unchecked Ways and Means financing and restoring greater monetary and fiscal discipline.

06Debt Management

Managing borrowing within approved fiscal and legislative limits while improving debt sustainability.

07Wage and Pension Support

Implementing minimum-wage increases, wage awards and improved payment of salaries, pensions and gratuities.

08Social and Consumer Finance

Expanding access to student finance, consumer credit, mortgages and social support.

09Infrastructure Investment

Increasing investment in transport, housing, agriculture, security, digital infrastructure, and other strategic projects.

10Energy Reform

Improving fuel availability, supporting electricity-sector reform and strengthening energy security.

11Investment and Growth Reforms

Restoring confidence, attracting capital and creating the conditions for stronger private sector-led growth.

What Has Changed — and What Could Have Been Worse?

Explore the economic reform scorecard.

The reforms imposed significant short-term costs, particularly through higher prices and exchange-rate adjustment. However, a number of key economic indicators have strengthened.

Baseline
Current position
What Do the Reforms Mean for Average Nigerians?

Connect the macro story to everyday life.

Higher wages and more timely payment of salaries and pensions

Higher minimum wages, wage awards and greater fiscal capacity to meet personnel obligations.

Settlement of pension arrears and gratuities

Greater capacity to meet obligations owed to retirees.

Wealth creation through the capital market

The significant increase in stock-market capitalisation has created wealth for millions of investors and strengthened companies’ ability to raise capital.

Transformative infrastructure development

Greater investment in roads, housing, agriculture, security and other critical infrastructure.

Student loans and affordable credit

NELFUND is expanding access to education financing, while CREDICORP and other programmes are expanding access to consumer and SME credit.

Housing and social support

Mortgage initiatives, housing programmes and social transfers are expanding support to households.

Agricultural interventions and food security

Government interventions are supporting agricultural production, value chains and efforts to improve food security.

Fuel availability and energy security

The reforms are intended to create a more sustainable energy market and reduce the recurring scarcity associated with the previous subsidy system.

Renewed investor confidence

Improved external stability and macroeconomic conditions are supporting stronger domestic and international investment.

A friendlier tax environment

Low-income earners and small businesses benefit from exemptions and reforms intended to reduce inappropriate taxation and simplify compliance.

What Harm Did the Reforms Seek to Prevent?

Without corrective reforms, Nigeria faced significant risks.

These included:

Hyperinflation caused by unchecked monetary financing
A deeper collapse in the value of the naira
Fuel scarcity and widespread disruption to economic activity
Greater poverty under a disorderly economic crisis
Worsening insecurity driven by economic stress
More business failures and job losses
Continued corruption and arbitrage in FX allocation and fuel subsidy administration
Bankruptcy risk for more states and local governments
Significantly higher interest rates
A proliferation of taxes that could deepen the taxation of poverty
FAQs

Your most important reform questions — answered simply.

By early 2023, the fiscal position had run out of room. A full year of petrol subsidy in 2023 was projected to cost about ₦6.7 trillion, about 70% of the Federal Government’s actual revenue. The 2023 budget had provided for only six months of subsidy, an explicit indication that removal was already the planned trajectory. Various assessments found the benefit of fuel subsidy accrued overwhelmingly to wealthier households and to cross-border smuggling, rather than to the poor. The subsidy was consuming the resources that should be deployed into building the roads, schools and clinics.

Phased removal is desirable in principle, but it requires a fiscal runway the country no longer had; a slow transition without pre-funded safety nets would have delivered the same household pain at greater cumulative cost to the treasury. Government therefore paired removal with cushioning measures: a temporary monthly wage award, palliative support to every state, conditional cash transfers, student loans through NELFUND and a CNG transport programme, while the fiscal savings now flow transparently through the Federation Account rather than through opaque under-recovery against federation crude oil revenue.
The objective was not devaluation but the end of the economic distortion and a multiple-window exchange-rate system in which the gap between the official and parallel rates had become a patronage channel: those with access to cheap official dollars resold them at street rates for guaranteed profit, while manufacturers, exporters and Nigerians with legitimate FX demand were starved of the foreign exchange they needed. With net reserves critically low and unmet FX obligations above US$7 billion, defending the official rate had become unsustainable. On 14 June 2023 the CBN collapsed the windows into a single willing-buyer, willing-seller market: a choice between managed adjustment and eventual collapse.

The short-term costs, a sharp fall in the naira and higher import prices, were anticipated and are not in dispute. But a market-reflective rate restores investor confidence and rebuilds reserves rather than depleting them. Since the float, gross external reserves have recovered to over US$52 billion, capital inflows have risen sharply, and a single, transparent market has restored the flow of foreign exchange to manufacturers, importers and investors.
Headline collection figures are gross Federation Account revenue, shared constitutionally across the Federal Government, 36 states and 774 local governments. Strong headline numbers do not accrue solely to the FG. The Nigeria Revenue Service exceeded its 2025 target, about ₦28.3 trillion against a ₦25.2 trillion target, but the Federal Government received less than it needs to meet recurrent expenditure, infrastructure, statutory transfers and debt service.

Borrowing bridges that gap. The 2026 budget of ₦68.32 trillion is set against ₦36.87 trillion of projected revenue, a ₦31.46 trillion deficit, within which capital expenditure is the single largest block at ₦32.29 trillion, ahead of debt service at ₦15.8 trillion. The more important question is whether borrowed funds are invested in projects that grow the economy. The 2025 tax reform is designed to widen the revenue base faster than debt service.
On internationally accepted metrics Nigeria’s debt remains sustainable, though real fiscal risks warrant vigilance. Total public debt was ₦159.28 trillion, about US$111 billion, at 31 December 2025. Much of the dramatic rise in the naira figure reflects recognition of about ₦30 trillion of historical Ways and Means advances and exchange-rate revaluation of existing dollar-denominated debt. On the DMO’s debt sustainability analysis the debt remains sustainable, and debt-to-GDP is around 36% on the rebased national accounts.

The binding constraint is the cost of servicing debt against low revenue. Debt service is expected to claim more than 40% of projected federal revenue in 2026, about ₦15.8 trillion against ₦36.87 trillion of revenue, crowding out health, education and security spending. The structural root cause is Nigeria’s low revenue-to-GDP ratio and the temporary interest-rate hike to tackle inflation, not excessive borrowing.
This concern is real and the government is focused on accelerating how the macro gains translate to meaningful impact for households. Reforms work through a phased transmission: first correcting macroeconomic imbalances and restoring stability; then rebuilding investor confidence and attracting productive capital; and gradually translating growth into jobs, incomes and living standards. The World Bank puts Nigeria’s poverty rate at about 63% in 2025, roughly 140 million people, even as inflation has begun to ease and the exchange rate has stabilised. These reforms did not create Nigeria’s poverty; they collided with it during the adjustment.

The early signals are measurable: the economy grew 3.89% year-on-year in Q1 2026 and headline inflation has been on a downward path. Government is running social investment alongside the macro correction through cash transfers, CREDICORP, NELFUND and tax changes that exempt small businesses and zero-rate essential food, medicines and educational materials.
External reserves are foreign-currency assets held by the Central Bank to meet external obligations, including external debt service and letters of credit for manufacturing inputs, equipment and medicines, and to stabilise the naira against shocks. They sit in a different pool from the naira-denominated federal budget or Federation Account. Nigeria has felt the cost of depleted reserves before: in 2015–16, low reserves tipped the economy into recession, and the poor bore the heaviest burden.

Reserves have recovered to over US$52 billion, a multi-year high, and that buffer is itself the mechanism behind naira stability and recent disinflation. Drawing reserves down to fund government spending would depreciate the currency and reverse those gains. Relief is correctly financed through the budget, alongside cash transfers, wage awards, student loans and support to states.
The premise overstates the FG’s position. Federation revenue is shared by constitutional formula across all three tiers, and in practice the federal share is not dominant. In March 2025, for example, the FG received about ₦528.7 billion from a gross FAAC pool of ₦2.41 trillion, almost identical to the roughly ₦530.4 billion shared among the 36 states, with local governments receiving about ₦387 billion. Once VAT and derivation are added, the Federal Government effectively receives less than 40% share.

Within its own share, the FG has been shifting decisively toward capital: capital expenditure rose to about 35% of the federal budget in 2025 and 47% in 2026, while overhead is around 4%. The task is to raise revenue and convert capital appropriations into completed projects, while continuing to publish implementation reports so citizens can hold institutions to account.
This is a normal pattern in the early phase of a reform rebound. Portfolio capital moves first because it is liquid and responds quickly to improved macro signals; FDI follows once investors are convinced reforms are durable and that infrastructure, rule of law, sanctity of contract and policy continuity are in place. Capital importation hit a record US$10.37 billion in Q1 2026, with foreign direct investment of over US$4 billion.

Investor confidence has returned and is rising. The metric to watch is the composition of inflows, and shifting it toward productive FDI is the explicit aim of initiatives in the oil sector, public-asset optimisation and sector reforms in power, security and logistics. Portfolio inflows confirm that phase one is working; a rising FDI share will confirm that phase two is delivering.
The momentum is real and measurable. On the official rebased national accounts, nominal GDP climbed from about US$250 billion in 2024 to roughly US$291 billion in 2025 and is rising further in 2026. Nigeria has its youngest large population and the continent’s biggest proven gas reserves. The US$1 trillion goal is the anchor that sets the pace.

The roadmap is investment-led and multi-pillar, anchored in the National Development Plan (2026–2030): fiscal and tax reform to raise domestic revenue, industrialisation policy, power-sector reform and security to unlock production, public-asset optimisation to release dormant value, and human-capital investment to lift productivity. Progress will show in 7%-plus growth, formal jobs, diversified exports and falling poverty.
The right answer is a mechanism, not a list of promises: a short set of specific, dated, independently-sourced indicators, published on a fixed calendar whether or not the reading is favourable. Citizens are entitled to demand that they appear on schedule, in plain language, through institutions Nigeria already funds.

A defensible core set includes headline inflation, real GDP growth, debt-service-to-revenue, federal capital-budget execution, external reserves, FDI share of inflows, non-oil revenue-to-GDP and the monetary poverty rate, each with a named source, baseline, direction or target, frequency and source.
Ask the Ministry

Have a question about Nigeria's public finances?

Choose the area that best matches your enquiry so it can be routed to the appropriate team.

Email: info@finance.gov.ng

Watch the briefing

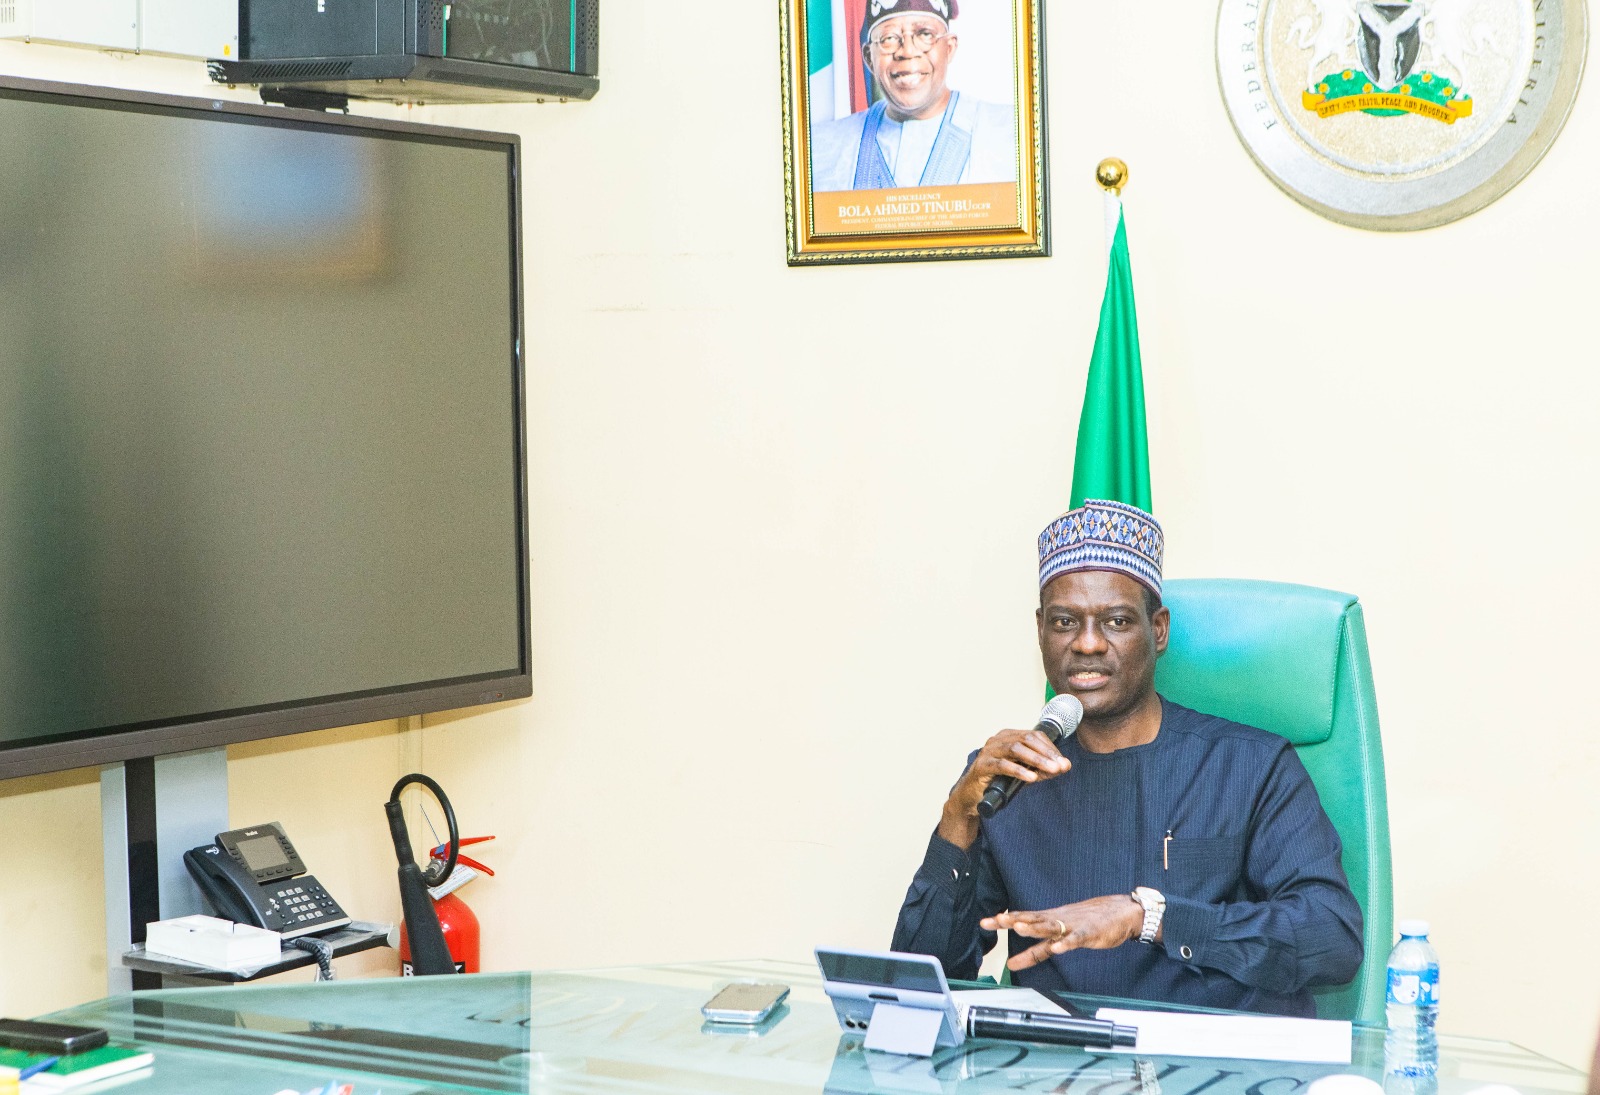
The reform story, in the Ministry's own words.

Watch the latest public briefing and hear how the numbers connect to Nigeria's economic reform agenda.

Evidence & Resources

See the evidence behind the story.